

Digital Communications: A Discrete-Time Approach
by Michael Rice

M-ary Quadrature Amplitude Modulation (MQAM)
Introduction
M-ary Quadrature Amplitude Modulation -- or QAM -- is a modulation where data bits select one of M combinations of amplitude and phase shifts that are applied to the carrier. The M possible waveforms may be described by M constellation points. In this exercise, the M = 16 constellation points are confined to a square grid. In this exercise, you will design an 16-QAM detector to process the data contained in the file qam16data.matTextbook References
M-ary QAM: Section 5.3, discrete-time realizations: Section 5.3.2, partial response pulse shapes: Section A.2.Specifications
 |
|
Preliminary Design
Design the Detector
Design the detector, shown below, using blocks from the Simulink, DSP System, and Communications System Toolboxes.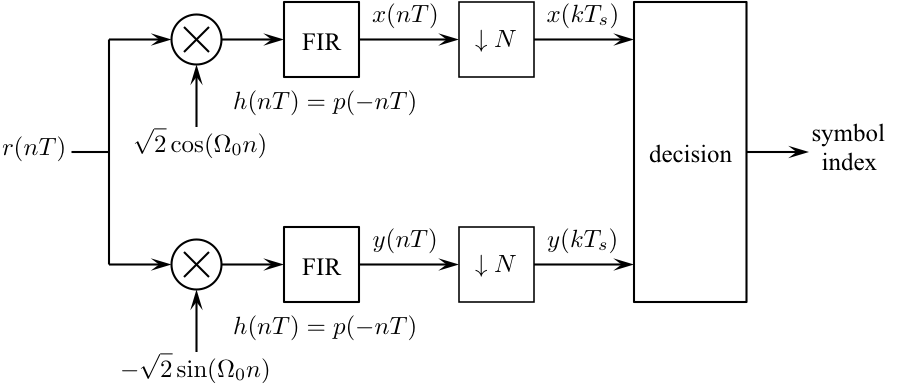
Test the Detector Design
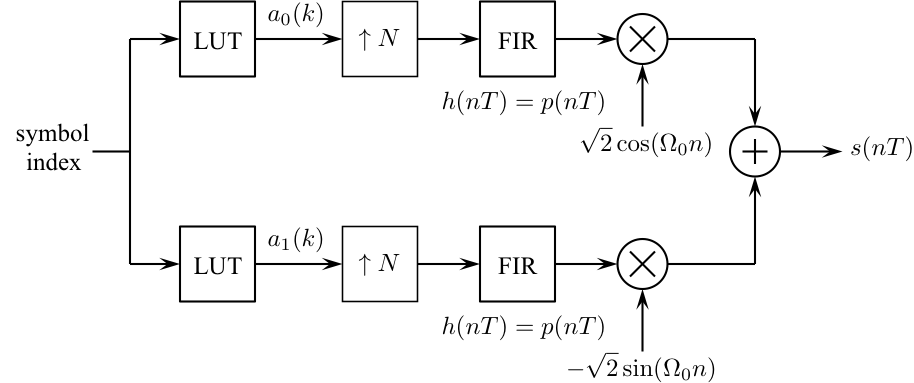
You should test the detector you designed by constructing a modulator to produce a test signal. The following procedure steps you through this design process:- Design the modulator shown below to meet the above specifications except
make the input the four symbol sequence 8 15 1 6.
- Connect the output of your modulator to the input of your detector.
- Connect the output of your detector to a To Workspace block (be sure to open the Properties Dialog Window and set the Save format to matrix) and a Scope block.
-
Set the simulation parameters as follows:
Simulation Time Start time: 0.0 Stop time: (16+4)*8-1 Solver selection Type: Fixed-step Solver: discrete (no continuous states)
Note: the stop time is computed as follows: 16 = 2*(span/2) [the delay of the pulse shaping filter plus the delay of the matched filter]; 4 = the number of data symbols; 8 = the number of samples/symbol. We subtract because the start time is t = 0.0. - Run the simulation and plot the demodulator input and the matched filter output on the same set of axes. The simulation produces 19 downsampled matched filter outputs -- the last 5 correspond to the sequence (8 15 1 6). Check the values in the workspace to see if they agree with input sequence (8 15 1 6).
- Examine the output of the Downsample block to see if the downsample operation is keeping the desired samples. Adjust the sample offset of the Downsample block to obtain the proper values.
Exercise
- Replace the modulator blocks with the From File block and set the Filename to qpskdata.mat and the sample time to 1.
-
Set the simulation parameters as follows:
Simulation Time Start time: 0.0 Stop time: (16+742)*8-1 Solver selection Type: Fixed-step Solver: discrete (no continuous states) - Run the simulation.
- The detector produces 758 symbol estimates. The last 742 of these correspond to 424 7-bit ASCII characters. Determine the message using either your Matlab script or an ASCII Table.
- Plot the eye diagram and signal space projections.
Brigham Young University - Provo |
Fulton College of Engineering |
The Church of Jesus Christ of Latter-day Saints
Department of Electrical and Computer Engineering, BYU, Provo, UT 84602 - (801)422-4012 - Copyright 2009. All Rights Reserved
Department of Electrical and Computer Engineering, BYU, Provo, UT 84602 - (801)422-4012 - Copyright 2009. All Rights Reserved